
Performance comparison
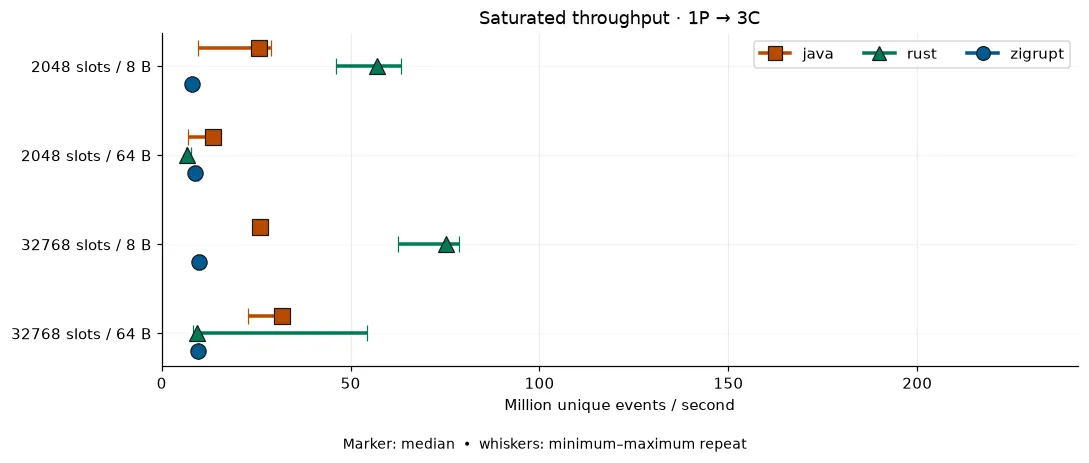
In the October 9, 2026 benchmark run, zigrupt led Java Disruptor in all four one-producer, one-consumer throughput workloads. With one producer and three consumers, it delivered about 8–10 million unique events/s and trailed Java in all four workloads. Rust’s lead depended on the payload: zigrupt was faster in two 64 B broadcast cases, while Rust was much faster in both 8 B broadcast cases.
What was measured
Section titled “What was measured”The run compared zigrupt with Java Disruptor 4.0.0 and disruptor-rs 4.4.0. It used one producer, one or three consumers, 2,048 or 32,768 ring slots, and 8 B or 64 B payloads. Each consumer processed every published event in the three-consumer cases. Workers were pinned to separate physical cores.
All correctness checks passed. The machine had four eligible physical cores, so the four-producer/one-consumer and three-producer/three-consumer workloads could not be measured. Each measured workload has three independent throughput repeats and three latency repeats at each offered rate. The benchmark methodology describes validation, warmup, and timing.
Saturated throughput
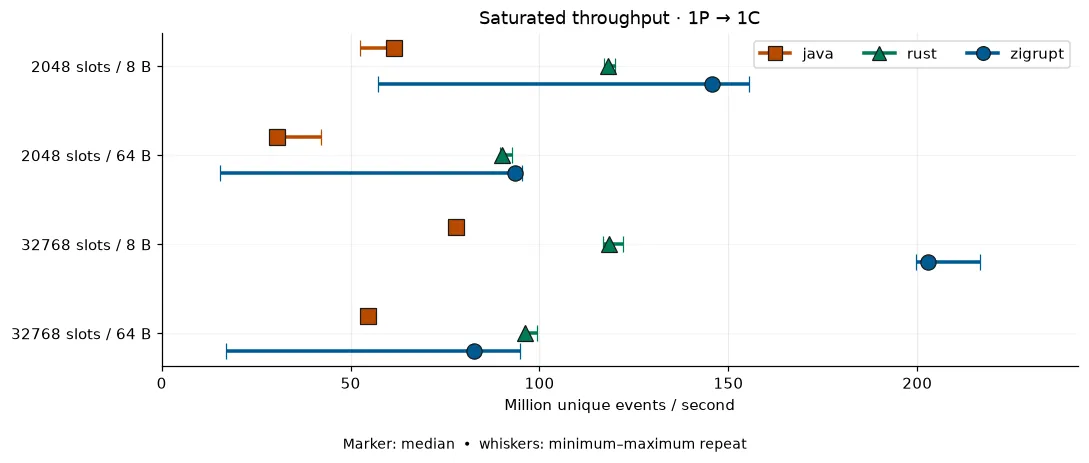
Section titled “Saturated throughput”Throughput counts unique events completed by every required consumer per second. A three-consumer broadcast therefore has three deliveries per event. Values below are medians of three repeats, in millions of events/s. The plots show the median and the minimum–maximum repeat range.
| Consumers | Slots | Payload | zigrupt | Java | Rust |
|---|---|---|---|---|---|
| 1 | 2,048 | 8 B | 145.7 | 61.4 | 118.3 |
| 1 | 2,048 | 64 B | 93.5 | 30.6 | 90.1 |
| 1 | 32,768 | 8 B | 202.9 | 77.9 | 118.4 |
| 1 | 32,768 | 64 B | 82.6 | 54.6 | 96.3 |
| 3 | 2,048 | 8 B | 8.0 | 25.7 | 57.1 |
| 3 | 2,048 | 64 B | 8.8 | 13.6 | 6.6 |
| 3 | 32,768 | 8 B | 9.9 | 26.0 | 75.3 |
| 3 | 32,768 | 64 B | 9.7 | 31.9 | 9.4 |
Zigrupt’s one-consumer rate ranged from 83 to 203 million events/s. It was 1.5–3.1× Java’s median and 0.86–1.71× Rust’s, depending on workload. Its three-consumer throughput was less than half of Java’s in three of four cases. Several one-consumer repeats varied widely, so the medians should be read with the plotted ranges.
Tail latency and delivered rate
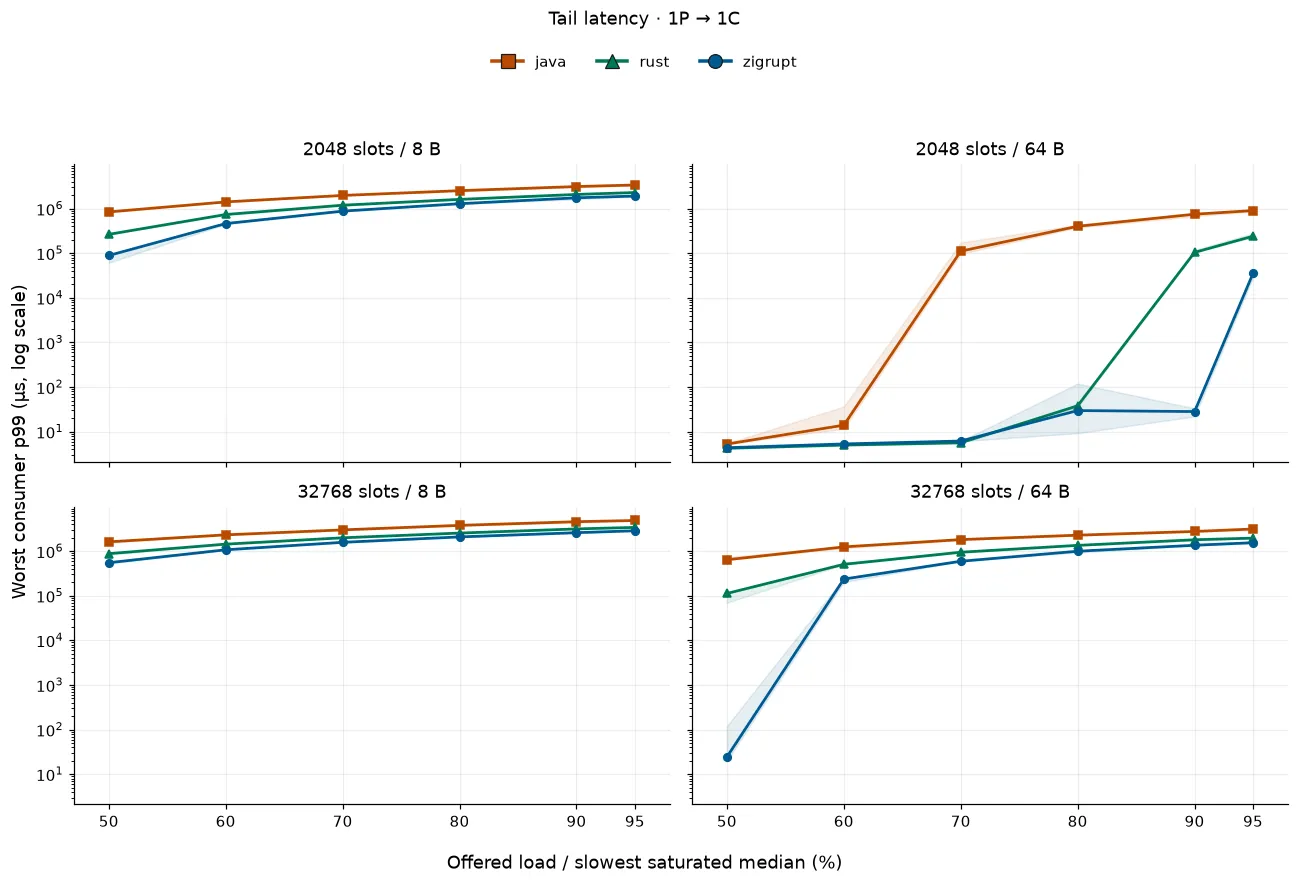
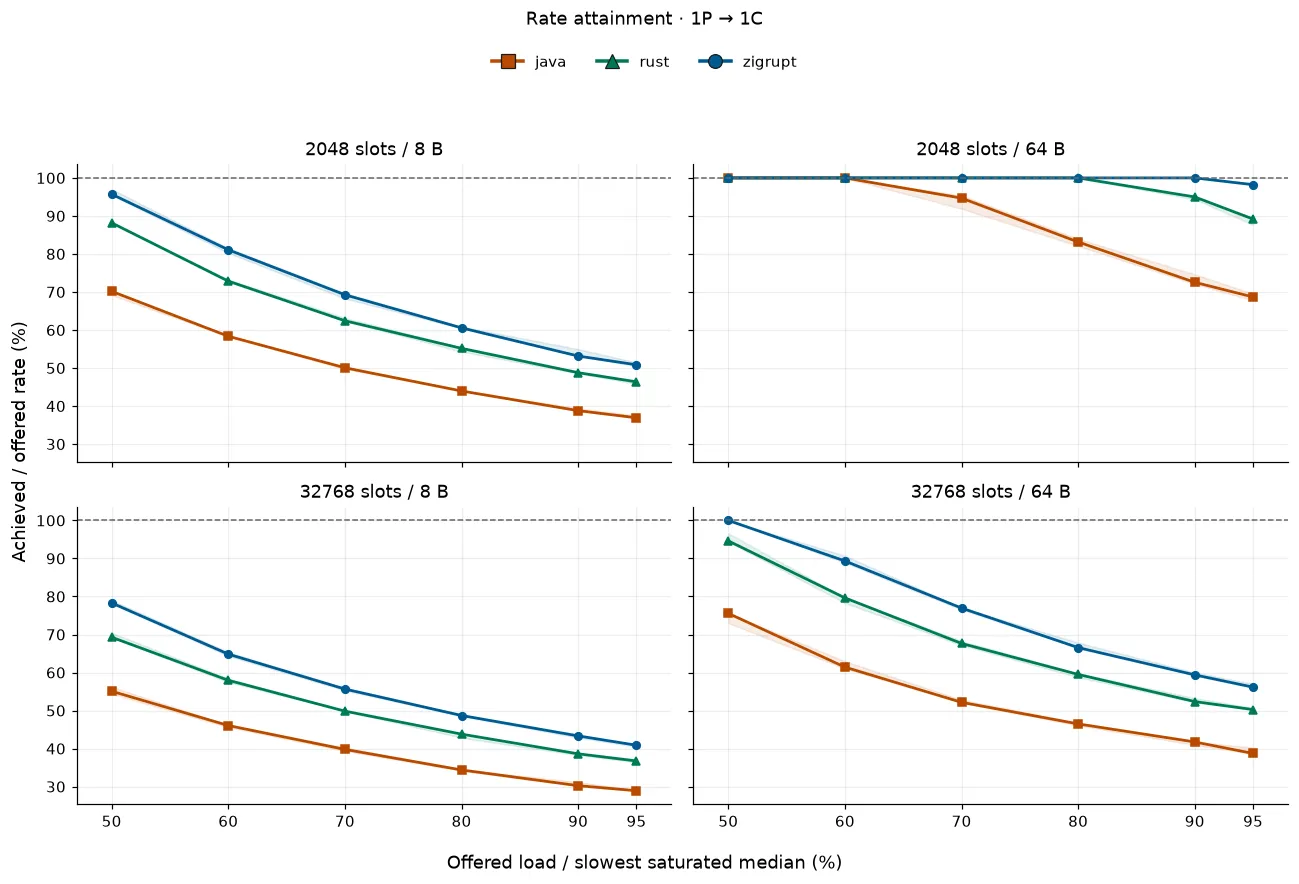
Section titled “Tail latency and delivered rate”Latency starts at an event’s scheduled arrival and ends when a consumer reads the clock after processing it. It includes producer delay, backpressure, and queueing. The six offered loads range from 50% to 95% of the slowest implementation’s median saturated throughput for each workload. The plots show the median worst-consumer p99 across three repeats; shaded bands show the observed repeat range. The latency axis is logarithmic.
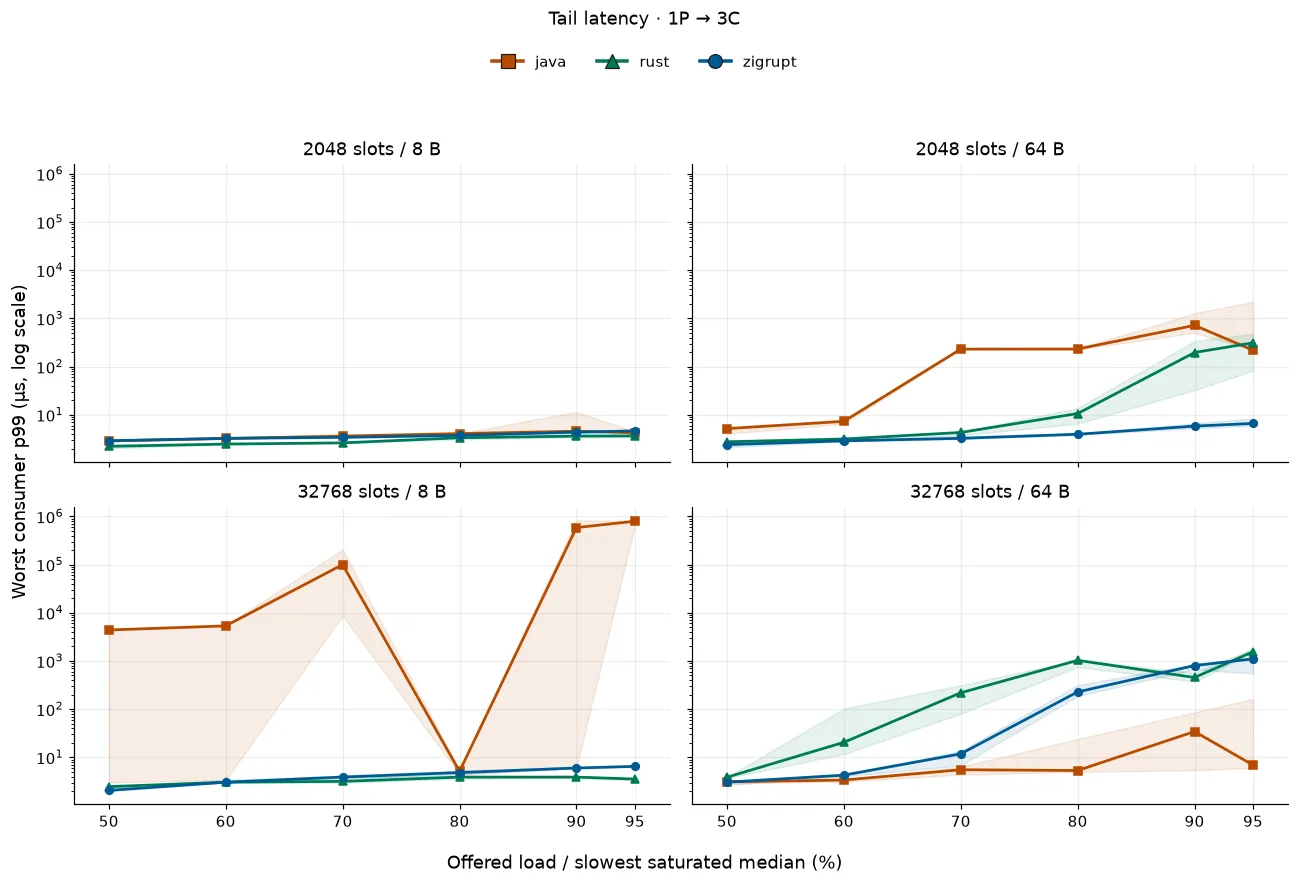
For three consumers, zigrupt’s median worst-consumer p99 at 50% offered load was 2.1–3.1 µs. At 95%, three workloads were at 4.6–6.6 µs; the 32,768-slot, 64 B workload rose to 1,104 µs despite sustaining its offered rate.
The one-consumer latency curves need their delivered rates alongside them. At 95% offered load, zigrupt completed only 41–56% of the schedule in three of the four workloads. Their large p99 values describe a growing backlog, rather than steady service at the requested rate. The rate plot shows this shortfall across all offered loads.
These results describe this run and machine, not a general ranking. The analysis notebook also includes the three-consumer rate, CPU, memory, and per-consumer plots.